Richest Cities in Pennsylvania (2026)
by Kristen Carney
Updated: February 9, 2026
Richest City in Pennsylvania
The richest city in Pennsylvania is Fox Chapel with an average household income of $383,987 as of 2024 and 5,246 people as of 2024 according to the most current Census data available (citation).
| Rank | City | County | Population | Average Income | Median Income |
|---|---|---|---|---|---|
| 1 | Fox Chapel | Allegheny | 5,246 | $383,987 | $243,625 |
| 2 | Sewickley Heights | Allegheny | 690 | $352,049 | $203,214 |
| 3 | Rose Valley | Delaware | 1,225 | $338,526 | $246,875 |
| 4 | Edgeworth | Allegheny | 1,587 | $326,675 | $202,813 |
| 5 | Upper Makefield | Bucks | 8,855 | $304,005 | $212,768 |
| 6 | Birmingham township | Chester | 4,098 | $289,207 | $215,000 |
| 7 | Lower Merion | Montgomery | 64,174 | $281,732 | $176,512 |
| 8 | Thornburg | Allegheny | 464 | $279,659 | $231,250 |
| 9 | West Pikeland | Chester | 4,038 | $277,984 | $226,071 |
| 10 | Charlestown | Chester | 6,320 | $272,076 | $202,188 |
| 11 | Pocopson | Chester | 4,469 | $269,529 | $230,000 |
| 12 | Easttown | Chester | 11,067 | $269,106 | $214,861 |
| 13 | Durham | Bucks | 1,047 | $266,667 | $116,458 |
| 14 | Radnor | Delaware | 33,718 | $259,251 | $164,359 |
| 15 | Solebury | Bucks | 8,685 | $258,336 | $195,962 |
| 16 | New Hope | Bucks | 2,622 | $258,149 | $175,156 |
| 17 | Chadds Ford | Delaware | 3,966 | $256,455 | $168,491 |
| 18 | Newlin | Chester | 1,240 | $254,331 | $160,341 |
| 19 | Ben Avon Heights | Allegheny | 304 | $254,034 | $234,375 |
| 20 | Buckingham township | Bucks | 20,852 | $252,279 | $190,230 |
Median Income versus Average Income: Which Should You Use?
We usually suggest using median income data – either instead of or in addition to – average income data as a true indicator of wealth. If you haven’t thought about median versus average since your last standardized test, you aren’t alone. Here’s what they are:
- average is the sum of a set of numbers divided by the count of numbers in the set
- median is the middle number in the set of numbers
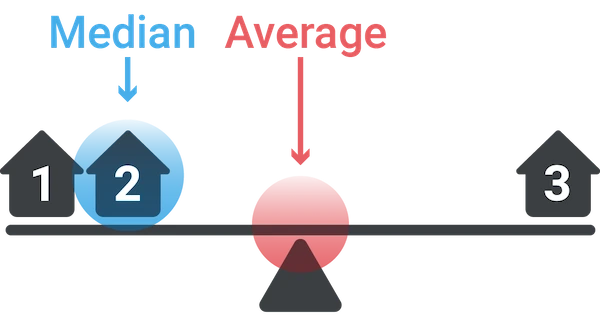
Now let’s say you had the following simplified set of income data.
Household 1: $30,000
Household 2: $50,000
Household 3: $1,000,000
The average income for this set is $360,000. The outlier data point ($1,000,000) skews the average WAY up. Conversely, the average income would be skewed WAY down if someone had an income of $500. The median income for the same data set is $50,000. Outlier data doesn’t skew the median.
Most Business Owners Should Use Median Income
So most business owners should use the median income as a true indicator of wealth, because it provides a more accurate representation of a typical income, especially in areas with significant income disparity.
When Should You Use Average Income
If your target market is high-income households, the average income may be more relevant. This is because the average income can highlight the presence of a higher concentration of wealthy individuals, which is beneficial for luxury goods and services marketing. We’re using average income on this page because using the Census’s highest reported median value of $250,001 could result in multiple ties for the richest geography.
Why do so many cities have a median value of $250,001?
The Census' American Community Survey uses $250,000+ as a jam value for median income estimates to protect privacy, ensure data consistency, and simplify reporting. A "jam value" in survey data refers to a placeholder or default value used when actual data points are unavailable, incomplete, or exceed certain thresholds. We represent this jam value as $250,001 to make it easy for you to sort.
You might also be interested in:
Email Me When New Data Are Released
Join thousands of subscribers and receive just 1 (ONE!) email a year in December when the US Census Bureau releases new income data for Pennsylvania richest cities.
SOURCES
United States Census Bureau. Annual Estimates of the Resident Population: April 1, 2020 to July 1, 2023. U.S. Census Bureau, Population Division. Web. May 2024. http://www.census.gov/.
United States Census Bureau. B01001 SEX BY AGE, 2024 American Community Survey 5-Year Estimates. U.S. Census Bureau, American Community Survey Office. Web. 29 January 2026. http://www.census.gov/.
United States Census Bureau. B19013 Median Household Income, 2024 American Community Survey 5-Year Estimates. U.S. Census Bureau, American Community Survey Office. Web. 29 January 2026. http://www.census.gov/.
United States Census Bureau. "DP03 SELECTED ECONOMIC CHARACTERISTICS." 2024 American Community Survey 5-Year Estimates. U.S. Census Bureau, American Community Survey Office. Web. 29 January 2026. http://www.census.gov/.
Products & Services
Plumbing
Connect
- 1-800-939-2130
- Contact Us
© Copyright 2026 Cubit Planning, Inc.